Women Economic Empowerment Index
![[IMAGE]](/sites/default/files/Field%20Office%20ESEAsia/Images/2016/11/pk-wee-9-IMG_1686-r2-675px.jpg?la=en)
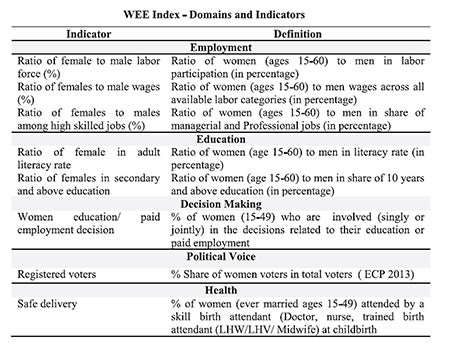
Before measuring women’s economic empowerment, we need to define it. The way it has been done in the status report on Women’s Economic Empowerment and Participation in Pakistan is that it is a function of their economic advancement and participation, their power and agency all gauged through choice, influence and freedom in decision making, access to and control over resources. Measuring all of this, hence, is an exercise in bringing together all these factors in one index for easy cross district comparisons. The Women Economic Empowerment Index (WEE Index) attempts to do so, examining 114 districts for which data was available. The table below describes the indicators and how they have been measured.
The index examines five areas, which are labour force participation, education, decision making, health and political participation. Proxies have been used for certain indicators where data was unavailable such as safe delivery for health of women as no other data is available regarding this e.g. nutrition.
Why We Need The WEE Index
The WEE Index draws attention to the dearth of robust data available at district level for a number of indicators that are important to assess women’s economic empowerment. The WEE Index can also be used as a tool by the provincial government and Planning Commission to measure women’s progress against national and international commitments to improve their status in economic, social and political spheres. There is also an absence of district level data on violence against women which is a key variable that impedes women’s advancement in all arenas of life. Leaving it out renders the WEE Index incomplete.
The Real Deal on Women’s Economic Empowerment
According to the index, Punjab performs best (0.52) in terms of women’s economic empowerment followed by Sindh (0.38), then KP (0.35) and finally Balochistan (0.26). The national figure stands at 0.39. The results are in line with the distribution of resources across provinces. Punjab has the most resources and as such, the education and health indicators are quite high. The ratio of women to men in the labour force is highest in Punjab and Sindh and low in Balochistan. The gender earnings ratio is higher in KP with women earning 68.5 per cent of what men earn and Punjab has a lower ratio than both Sindh and KP. There are more women in managerial positions in KP by double than all of the other provinces. This observation can be explained by government and non-government humanitarian programs that encourage women pursuing careers and employment, a higher concentration of women with higher education in fewer jobs in the province or data anomalies.
It is concerning that agency, which is reflected by women’s ability to make critical decisions about education and paid employment, is low in all provinces except Punjab where it is slightly higher.
Intra-provincial and inter- provincial differences are compared across the districts with a high WEE Index value and those with a low WEE Index value in each province. Inequalities between low and high districts are greatest in Balochistan with an overall WEE Index of 0.108 for Sherani district compared to 0.511 for Quetta. This reflects urban/rural divide, the geographic location and terrain of the districts. Remoteness from provincial center appears to be a factor in the low index for these districts.
Violence against women is a key problem that needs to be measured as well, however due to a dearth of district or even division level data, it has proven to weaken the robustness of WEE Index in measuring overall women’s economic empowerment.